


一、使用ansible搭建prometheus监控系统
1.部署环境
我们在运维机(81)上使用ansible将prometheus软件部署在应用服务器(21、22)、nginx代理服务器(11、12),监控这4台机器的运行状态并添加告警。
2.prometheus工作原理
2.1. 数据采集
Prometheus 通过 拉取(pull) 的方式从目标系统采集指标数据。它定期向配置好的目标(如应用程序、数据库、Web服务器等)发送 HTTP 请求,获取指标信息。指标通常是以 Prometheus Exposition Format 或 OpenMetrics 格式 呈现的。
例如,Prometheus 可以定期抓取你的 web 服务的 /metrics 端点,该端点输出应用的性能指标。
2.2. 数据存储
Prometheus 使用 时间序列数据库 存储采集到的指标数据。每一条数据都被标识为一个时间序列,包含以下几个部分:
Metric name:指标名称(如
http_requests_total)。Labels:标签,用来标识指标的维度(如
method="GET",status="200")。Timestamp:数据采集的时间戳。
Value:指标的数值。
Prometheus 内部以 时序(time-series)存储数据,这使得它能够非常高效地处理大量的时序数据。
2.3. 数据查询
Prometheus 提供了强大的查询语言 PromQL(Prometheus Query Language),用于查询存储的时间序列数据。PromQL 支持多种查询功能,包括:
聚合操作:如求和、平均值、最大值、最小值等。
时间范围选择:可以指定时间范围来查询数据。
数据过滤和分组:通过标签进行过滤、分组、排序等操作。
例如,使用以下查询可以获取过去 1 小时内 HTTP 请求的总数:
Codesum(increase(http_requests_total[1h]))
2.4. 报警与告警(Alerting)
Prometheus 提供了内建的 报警(Alerting)功能,通过 Alertmanager 进行管理和通知。Prometheus 可以根据预定义的告警规则,在指标超过设定阈值时触发告警。
Alerting Rules:可以在 Prometheus 配置文件中定义报警规则。例如,如果某个服务的响应时间过高,或者 CPU 使用率过高时,就可以触发报警。
Alertmanager:是 Prometheus 的一个组件,负责处理和发送报警通知,可以支持多种通知方式,如电子邮件、Slack、PagerDuty 等。
2.5. 数据可视化
Prometheus 本身不提供复杂的图表或仪表盘功能,但它与 Grafana 等可视化工具高度兼容。通过将 Prometheus 作为数据源,Grafana 可以提供丰富的图表、仪表盘和可视化分析功能。
2.6. 数据采集模式(Pull vs Push)
Prometheus 主要使用 拉取(Pull) 模式,但它也支持 推送(Push) 模式,通常用于一些不容易被 Prometheus 直接访问的短生命周期的任务或批处理作业。为了实现这一点,Prometheus 提供了 Pushgateway,用于接收短暂的任务或批量作业的指标。
2.7. 集成与生态系统
Prometheus 与许多开源工具、云平台和监控系统集成,广泛支持各种语言的客户端库,能够监控几乎所有现代应用程序、容器、微服务等。常见的集成包括:
Kubernetes:Prometheus 可以与 Kubernetes 集成,自动发现服务,并对容器和 Pod 进行监控。
Exporter:许多第三方 exporter 被用来从不同的应用和基础设施中导出数据。例如,Node Exporter(监控主机性能)、Blackbox Exporter(监控外部服务)等。
2.8. 高可用性和水平扩展
Prometheus 本身并没有原生的高可用性支持,但可以通过 Prometheus Federation 或者 HA Setup 进行水平扩展。通常做法是部署多个 Prometheus 实例进行数据收集,并在需要时聚合这些实例的数据。
3.部署过程
将`node_exporter-1.3.1.linux-amd64.tar.gz`、`prometheus-2.37.0-rc.1.linux-amd64.tar.gz`、`prometheus.yml`及`node-exporter.yml`上传到运维机(81)上。
运维机(81)作为收集器,收集11、12、21、22模板中定义的性能指标。只需要安装`prometheus-2.37.0-rc.1.linux-amd64.tar.gz`。其他4台机器都需要安装`node_exporter-1.3.1.linux-amd64.tar.gz`。
下面开始安装收集器:
[root@jx-ops-81 opt]# tar -xvf prometheus-2.37.0-rc.1.linux-amd64.tar.gz
[root@jx-ops-81 opt]# cd prometheus-2.37.0-rc.1.linux-amd64
[root@jx-ops-81 prometheus-2.37.0-rc.1.linux-amd64]# ls
console_libraries  consoles  LICENSE  NOTICE  prometheus  prometheus.yml  promtool
[root@jx-ops-81 prometheus-2.37.0-rc.1.linux-amd64]# cp ../prometheus.yml .
cp: overwrite './prometheus.yml'? y
将模板`prometheus.yml`覆盖源文件。然后编辑我们自己的文件,我们需要创建rules文件夹并把`exporter.yml`文件上传到此处。该文件的作用是定义主机监控告警规则。
[root@jx-ops-81 prometheus-2.37.0-rc.1.linux-amd64]# vim prometheus.yml
global:
  scrape_interval:     60s
  evaluation_interval: 60s
rule_files:
  - "rules/*.yml"                              #引用自定义告警规则文件

scrape_configs:
  - job_name: prometheus                        # 监控自己
    static_configs:
      - targets: ['localhost:9090']
        labels:
          instance: prometheus

  - job_name: jx-host                            # 定义监控组,给每个成员打标签便于筛选
    static_configs:
      - targets: ['10.10.10.11:9100']
        labels:
          instance: jx-nginx-11
      - targets: ['10.10.10.12:9100']
        labels:
          instance: jx-nginx-12
      - targets: ['10.10.10.21:9100']
        labels:
          instance: jx-busi-21
      - targets: ['10.10.10.22:9100']
        labels:
          instance: jx-busi-22
使用ansible完成11 、12 、21、22 上node_exporter的部署。先定义hosts。
vim /etc/ansible/hosts

[jxbusi]
10.10.10.21
10.10.10.22
[jxbusi:vars]
ansible_ssh_user=root
ansible_ssh_pass=1029qwe..
[jxnginx]
10.10.10.11
10.10.10.12
[jxnginx:vars]
ansible_ssh_user=root
ansible_ssh_pass=1029qwe..
测试链接是否正常
[root@jx-ops-81 ~]# ansible all -a "ls /tmp"开始部署:
[root@jx-ops-81 ~]# ansible all -m copy -a  "src=/opt/node_exporter-1.3.1.linux-amd64.tar.gz dest=/opt"
[root@jx-ops-81 ~]# ansible all -a "ls /opt"
[root@jx-ops-81 ~]# ansible all -m shell -a "tar -xvf /opt/node_exporter-1.3.1.linux-amd64.tar.gz -C /opt"
注意:ansible运行命令时一定要用绝对路径。
启动node_expoter
[root@jx-ops-81 ~]# ansible all -m shell -a "nohup /opt/node_exporter-1.3.1.linux-amd64/node_exporter &"81上启动prometheus
[root@jx-ops-81 prometheus-2.37.0-rc.1.linux-amd64]# cp ../node-exporter.yml rules/
[root@jx-ops-81 prometheus-2.37.0-rc.1.linux-amd64]# ls -l rules/
total 20
-rw-r--r-- 1 root root 19684 Dec 13 15:18 node-exporter.yml
[root@jx-ops-81 prometheus-2.37.0-rc.1.linux-amd64]# nohup ./prometheus &
我们需要从浏览器访问,所以还需要再网关服务器上将81的9090端口映射出去
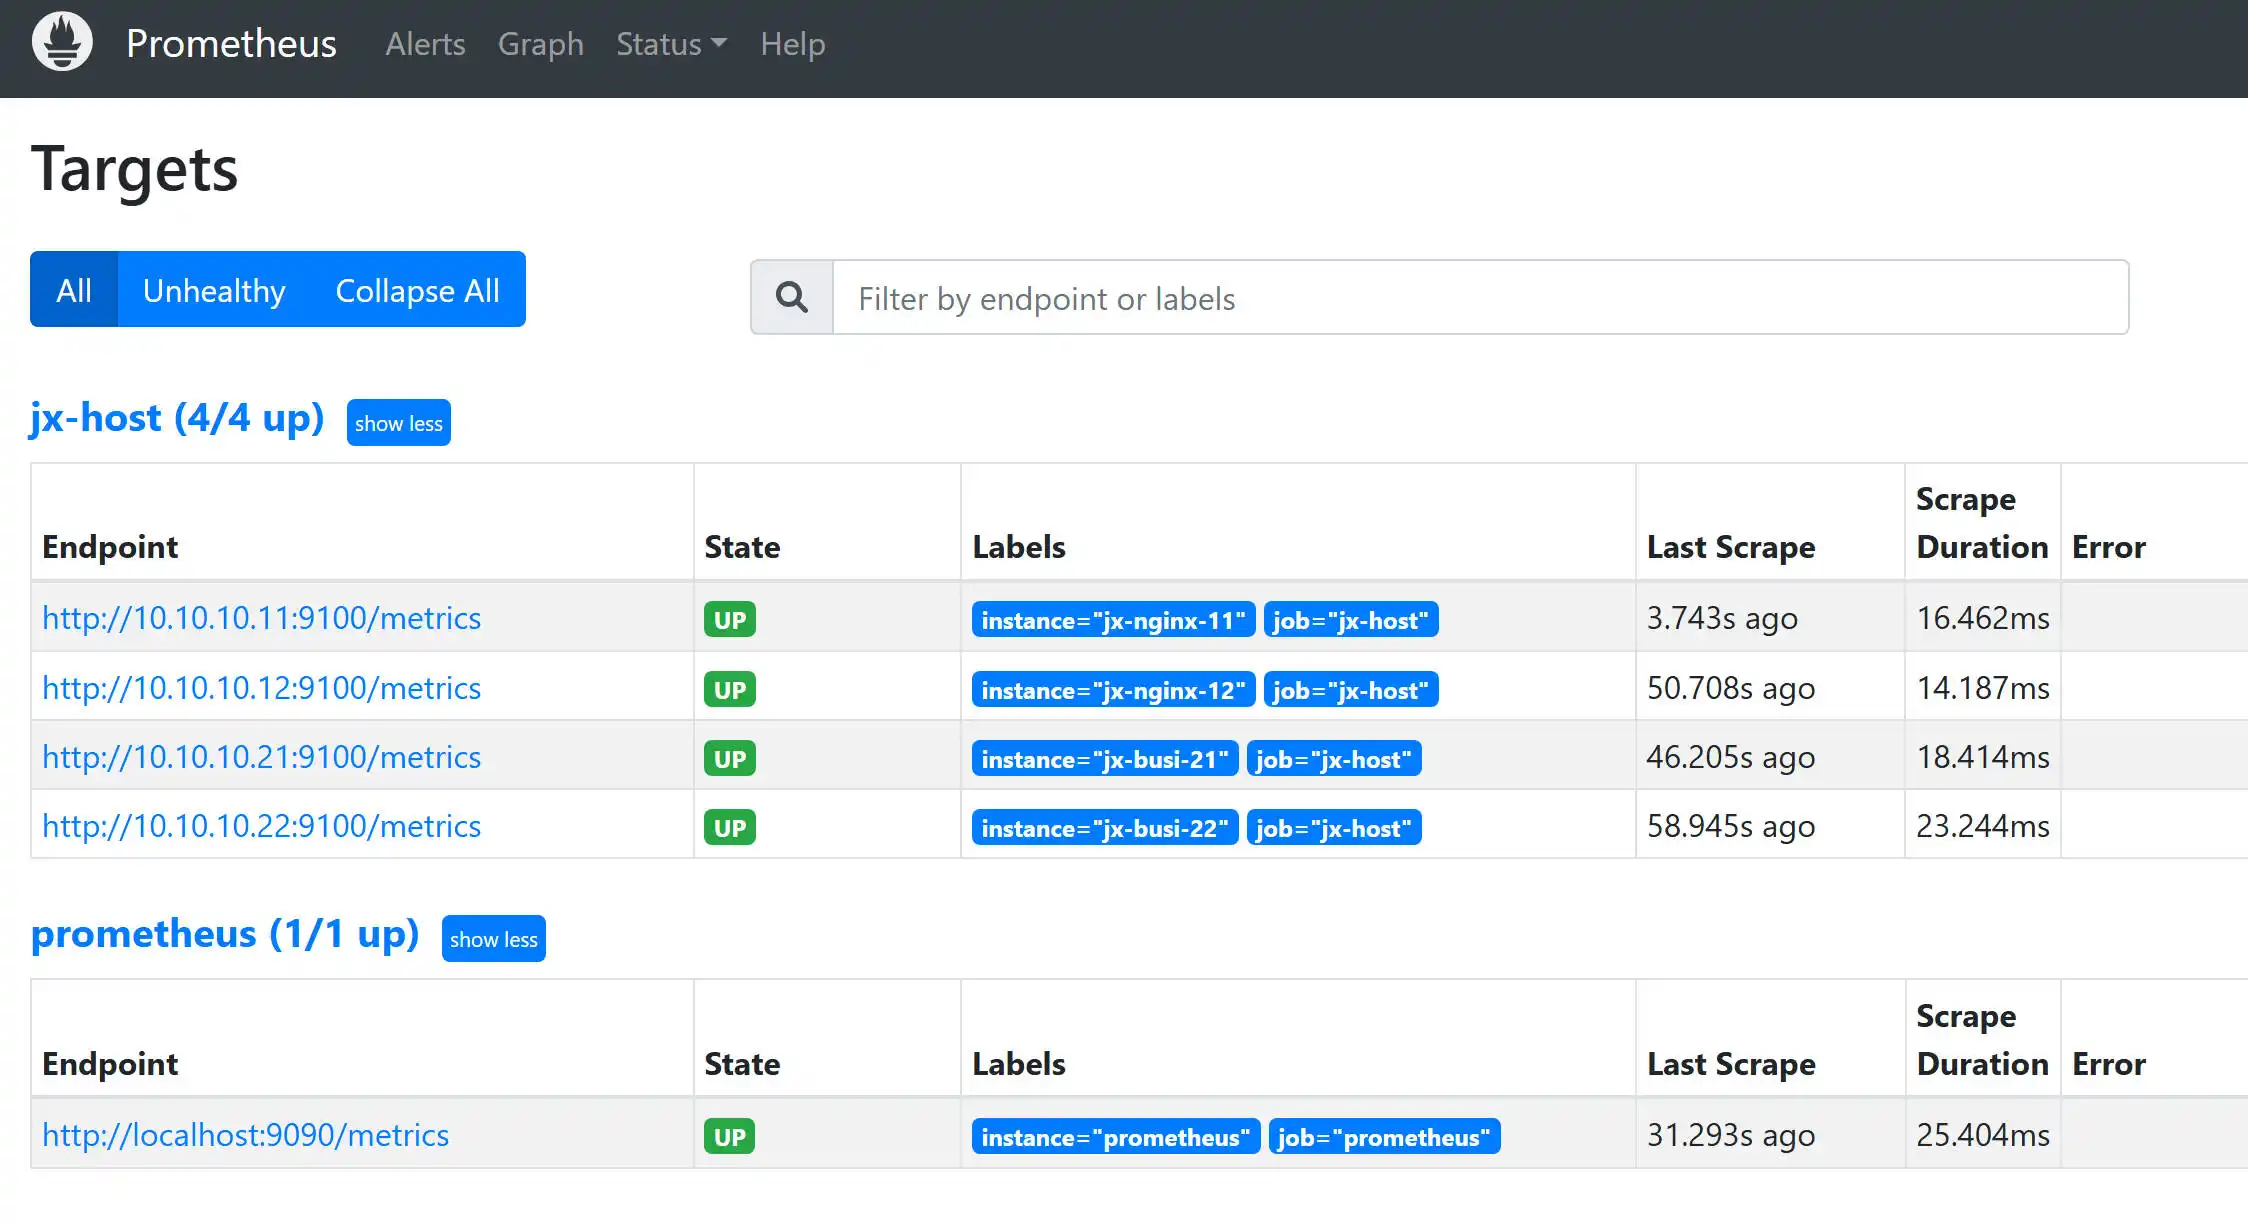
[root@jx-gateway-254 opt]# iptables -t nat -A PREROUTING -d 10.0.3.15/32 -p tcp -m tcp --dport 9090 -j DNAT --to-destination 10.10.10.81:9090我们从浏览器访问:http://127.0.0.1:9090/status
可以查询到当前运维机81和11、12、21、22状态了。
http://127.0.0.1:9090/metrics 这个显示的结果是所有主机的采集监控状态。
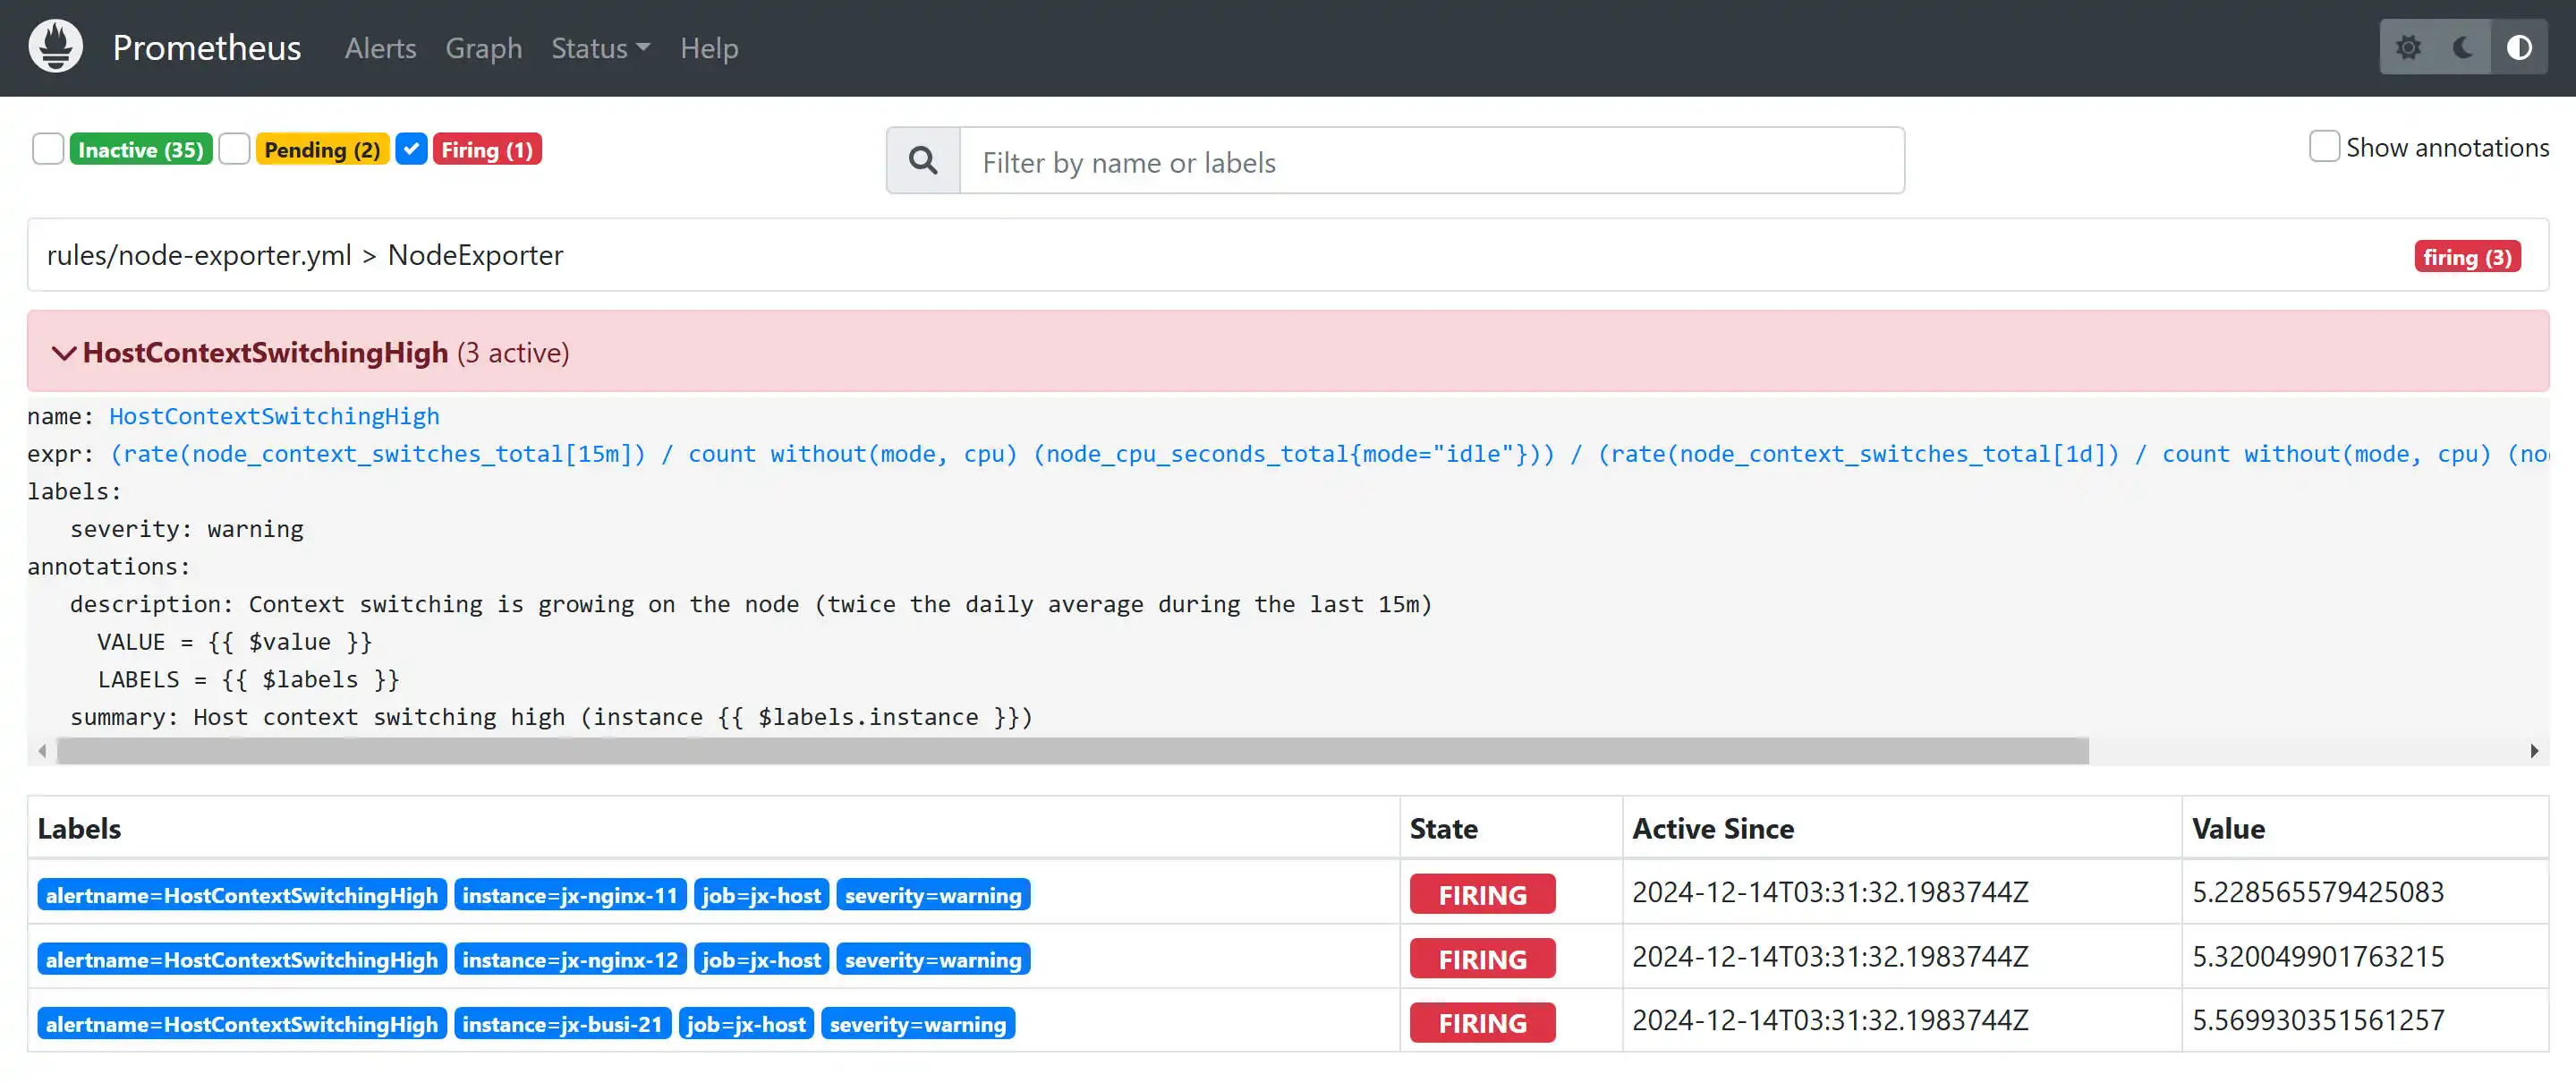
告警,可以点开查看具体信息。
二、grafana部署,展示prometheus采集指标
1.grafana简介
Grafana 是一个开源的数据可视化和监控平台,广泛应用于实时数据的展示和分析。它支持多种数据源(如 Prometheus、InfluxDB、Elasticsearch、MySQL、PostgreSQL 等),能够通过美观、交互式的仪表板展示数据。
应用场景:
系统监控:实时查看服务器、网络设备、数据库等的性能数据。
应用监控:分析应用程序的性能指标,如响应时间、错误率等。
业务监控:通过集成与业务相关的数据源,实时监控业务指标,如销售数据、用户活动等。
2.部署过程
我们在运维机(81)上部署grafana。将`grafana-8.0.6-1.x86_64.rpm`上传到运维机,开始安装。由于grafana需要的依赖较多,我们可以使用yum安装在线补充依赖。
[root@jx-ops-81 opt]# yum install -y grafana-8.0.6-1.x86_64.rpm启动服务
[root@jx-ops-81 opt]# systemctl start grafana-server我们需要从浏览器访问,所以还需要在网关服务器上将81的3000端口映射出去。
[root@jx-gateway-254 opt]# iptables -t nat -A PREROUTING -d 10.0.3.15/32 -p tcp -m tcp --dport 3000 -j DNAT --to-destination 10.10.10.81:3000我们访问127.0.0.1:3000 ,初始的用户名和密码是:admin/admin。
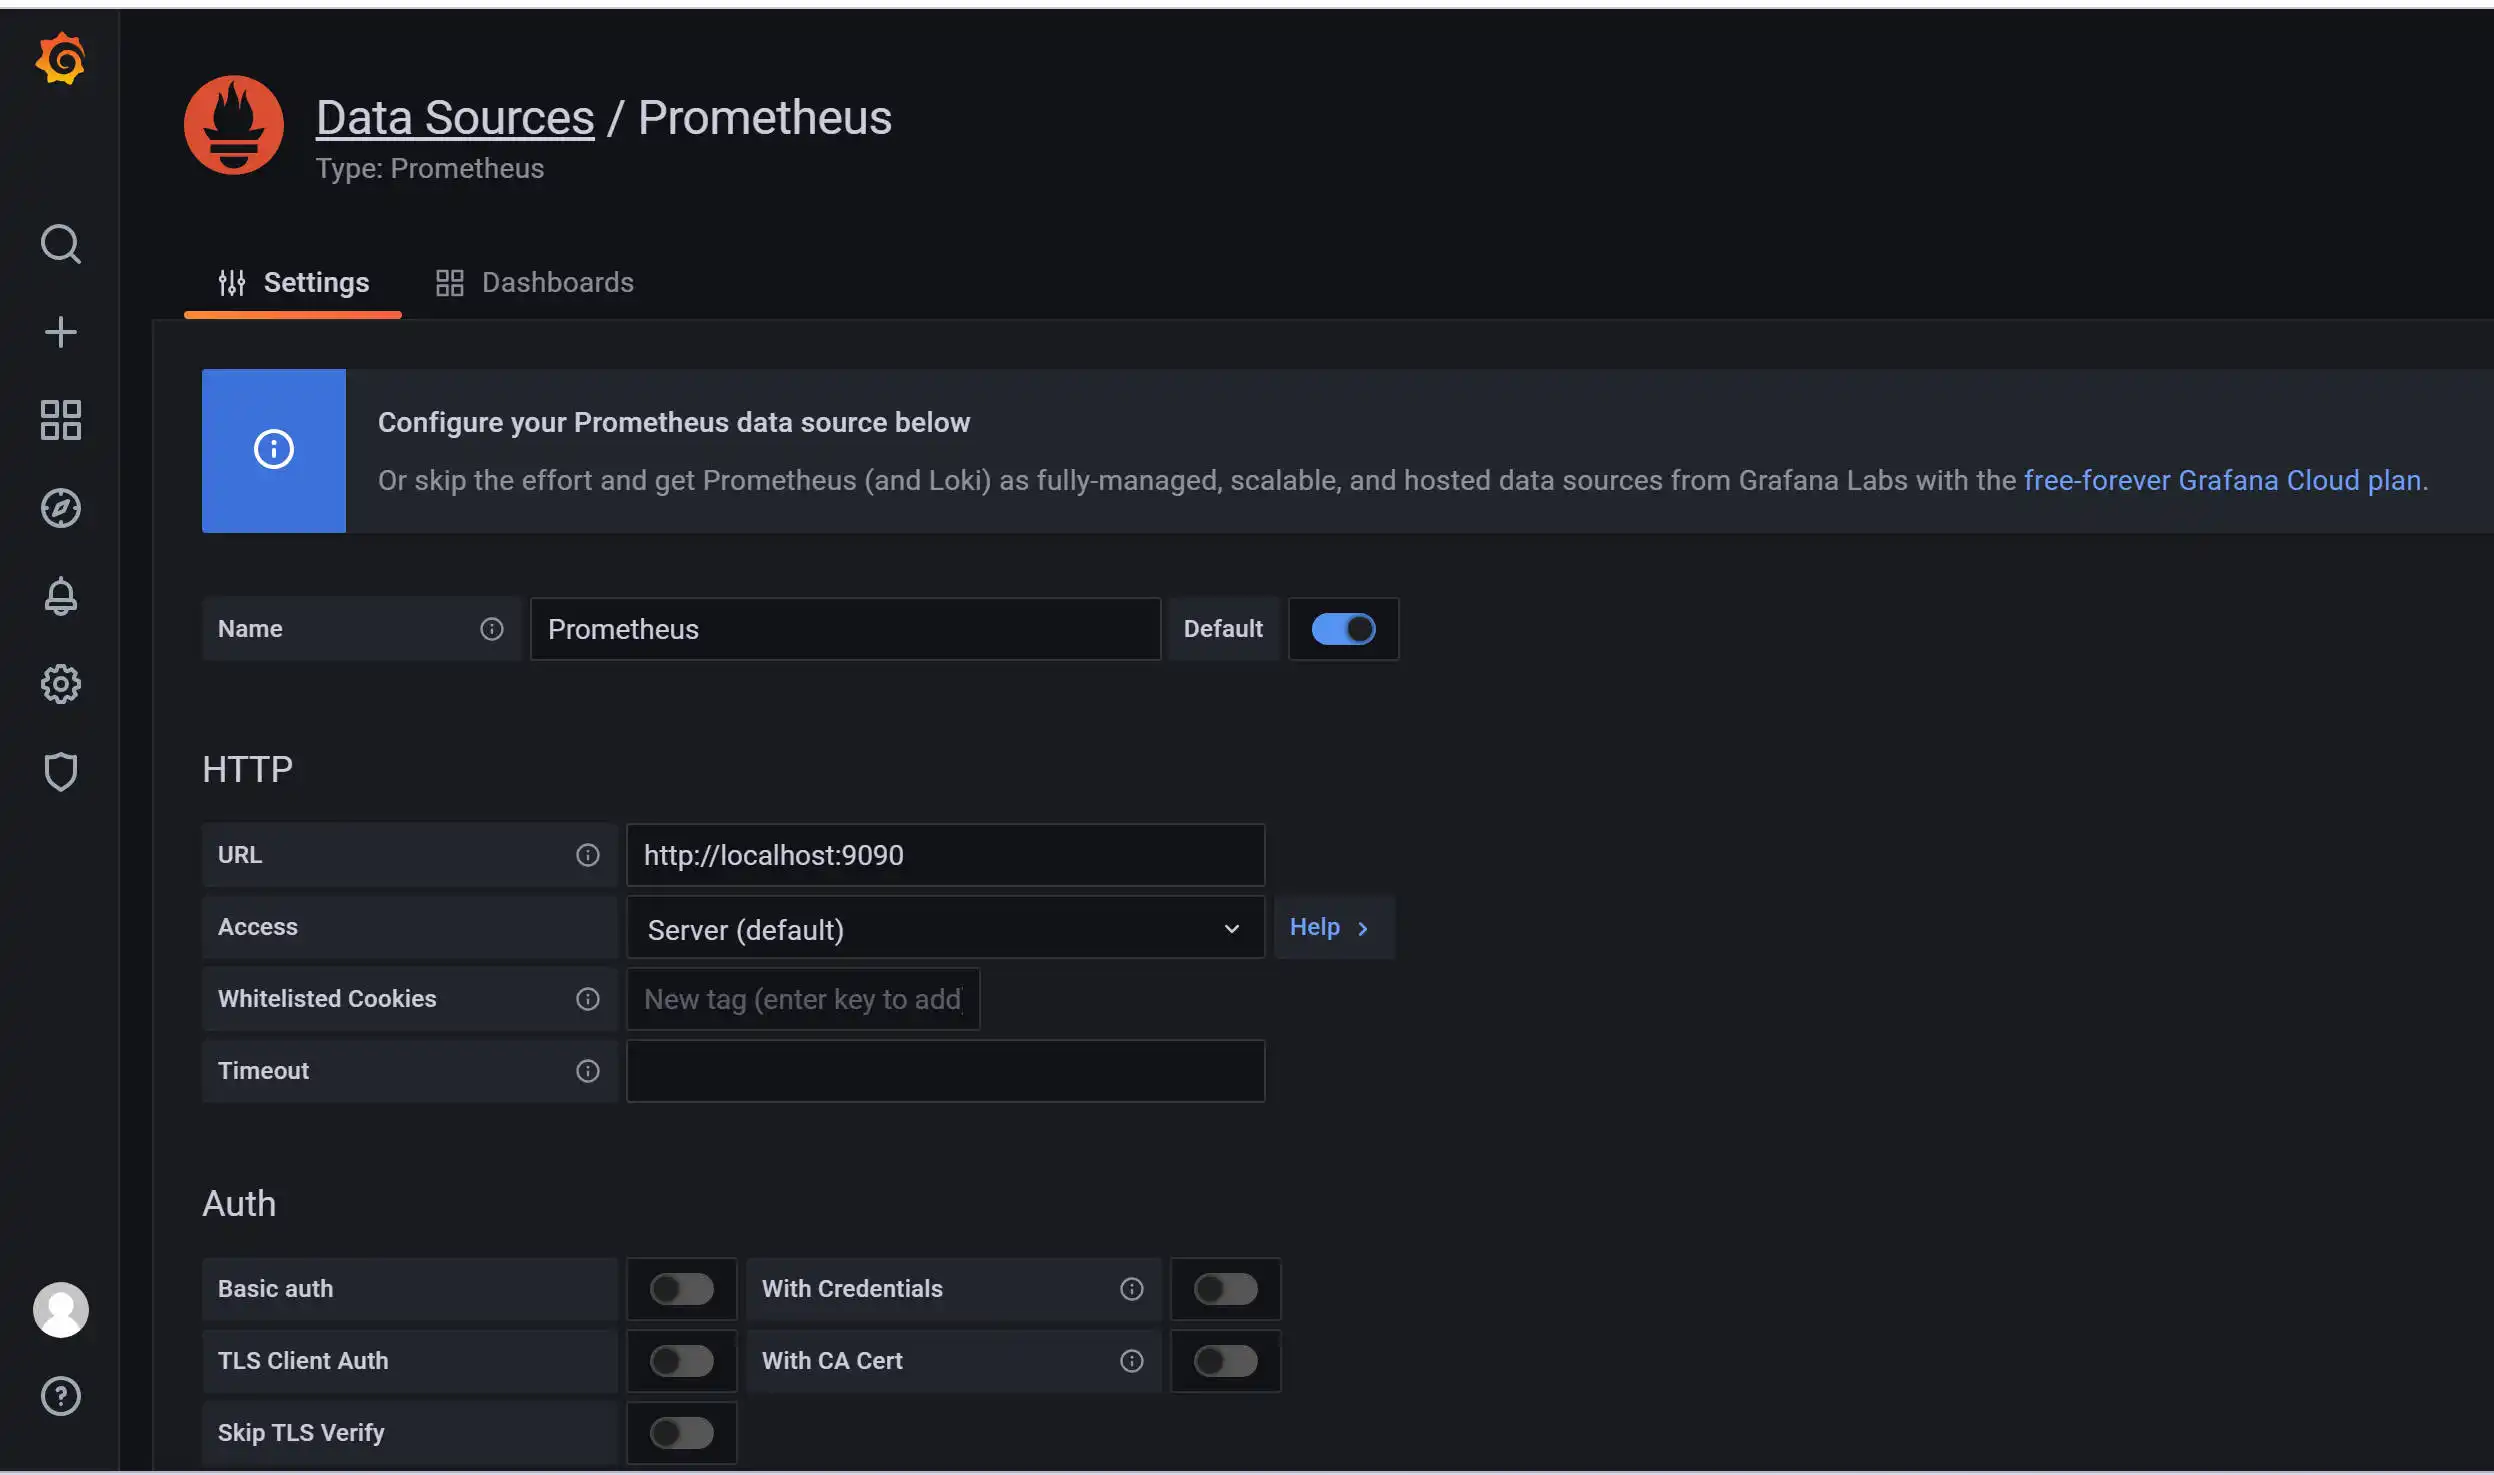
进入之后我们先添加数据源:
选择Prometheus,由于我们Prometheus和grafana都安装在运维机上,所以url添加http://localhost:9090,保存即可。
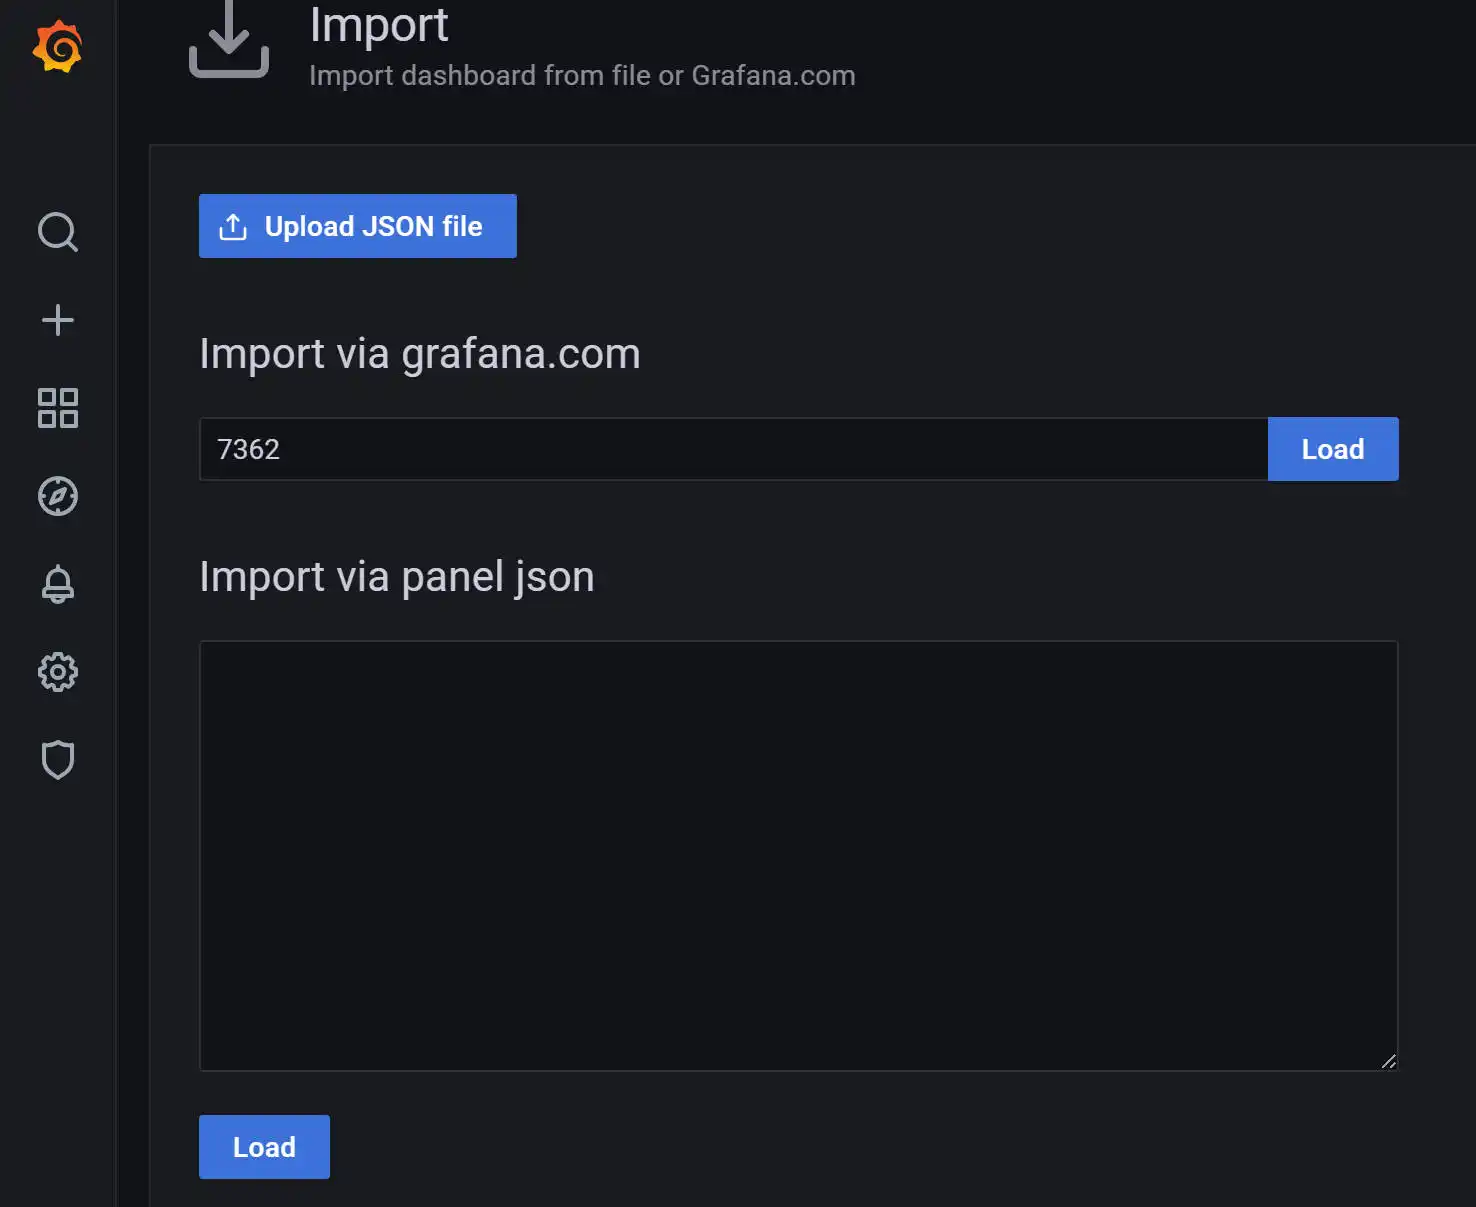
下面我们来添加监控面板。
通过import 输入id,从互联网上搜索可用的监控面板拉取到本地。
常用的几个监控面板id(从互联网上搜集的)
NodeExporter
ID:16522
ID:9276
Blackbox-Exporter
ID:13659
Mysql
ID: 7362:mysql overview
ID:7371 :mysql replication
ID:14057
jvm
ID:8563
windows
ID:13261,Windows System Overview
zookeeper
ID:10465
clickhouse
ID:14192
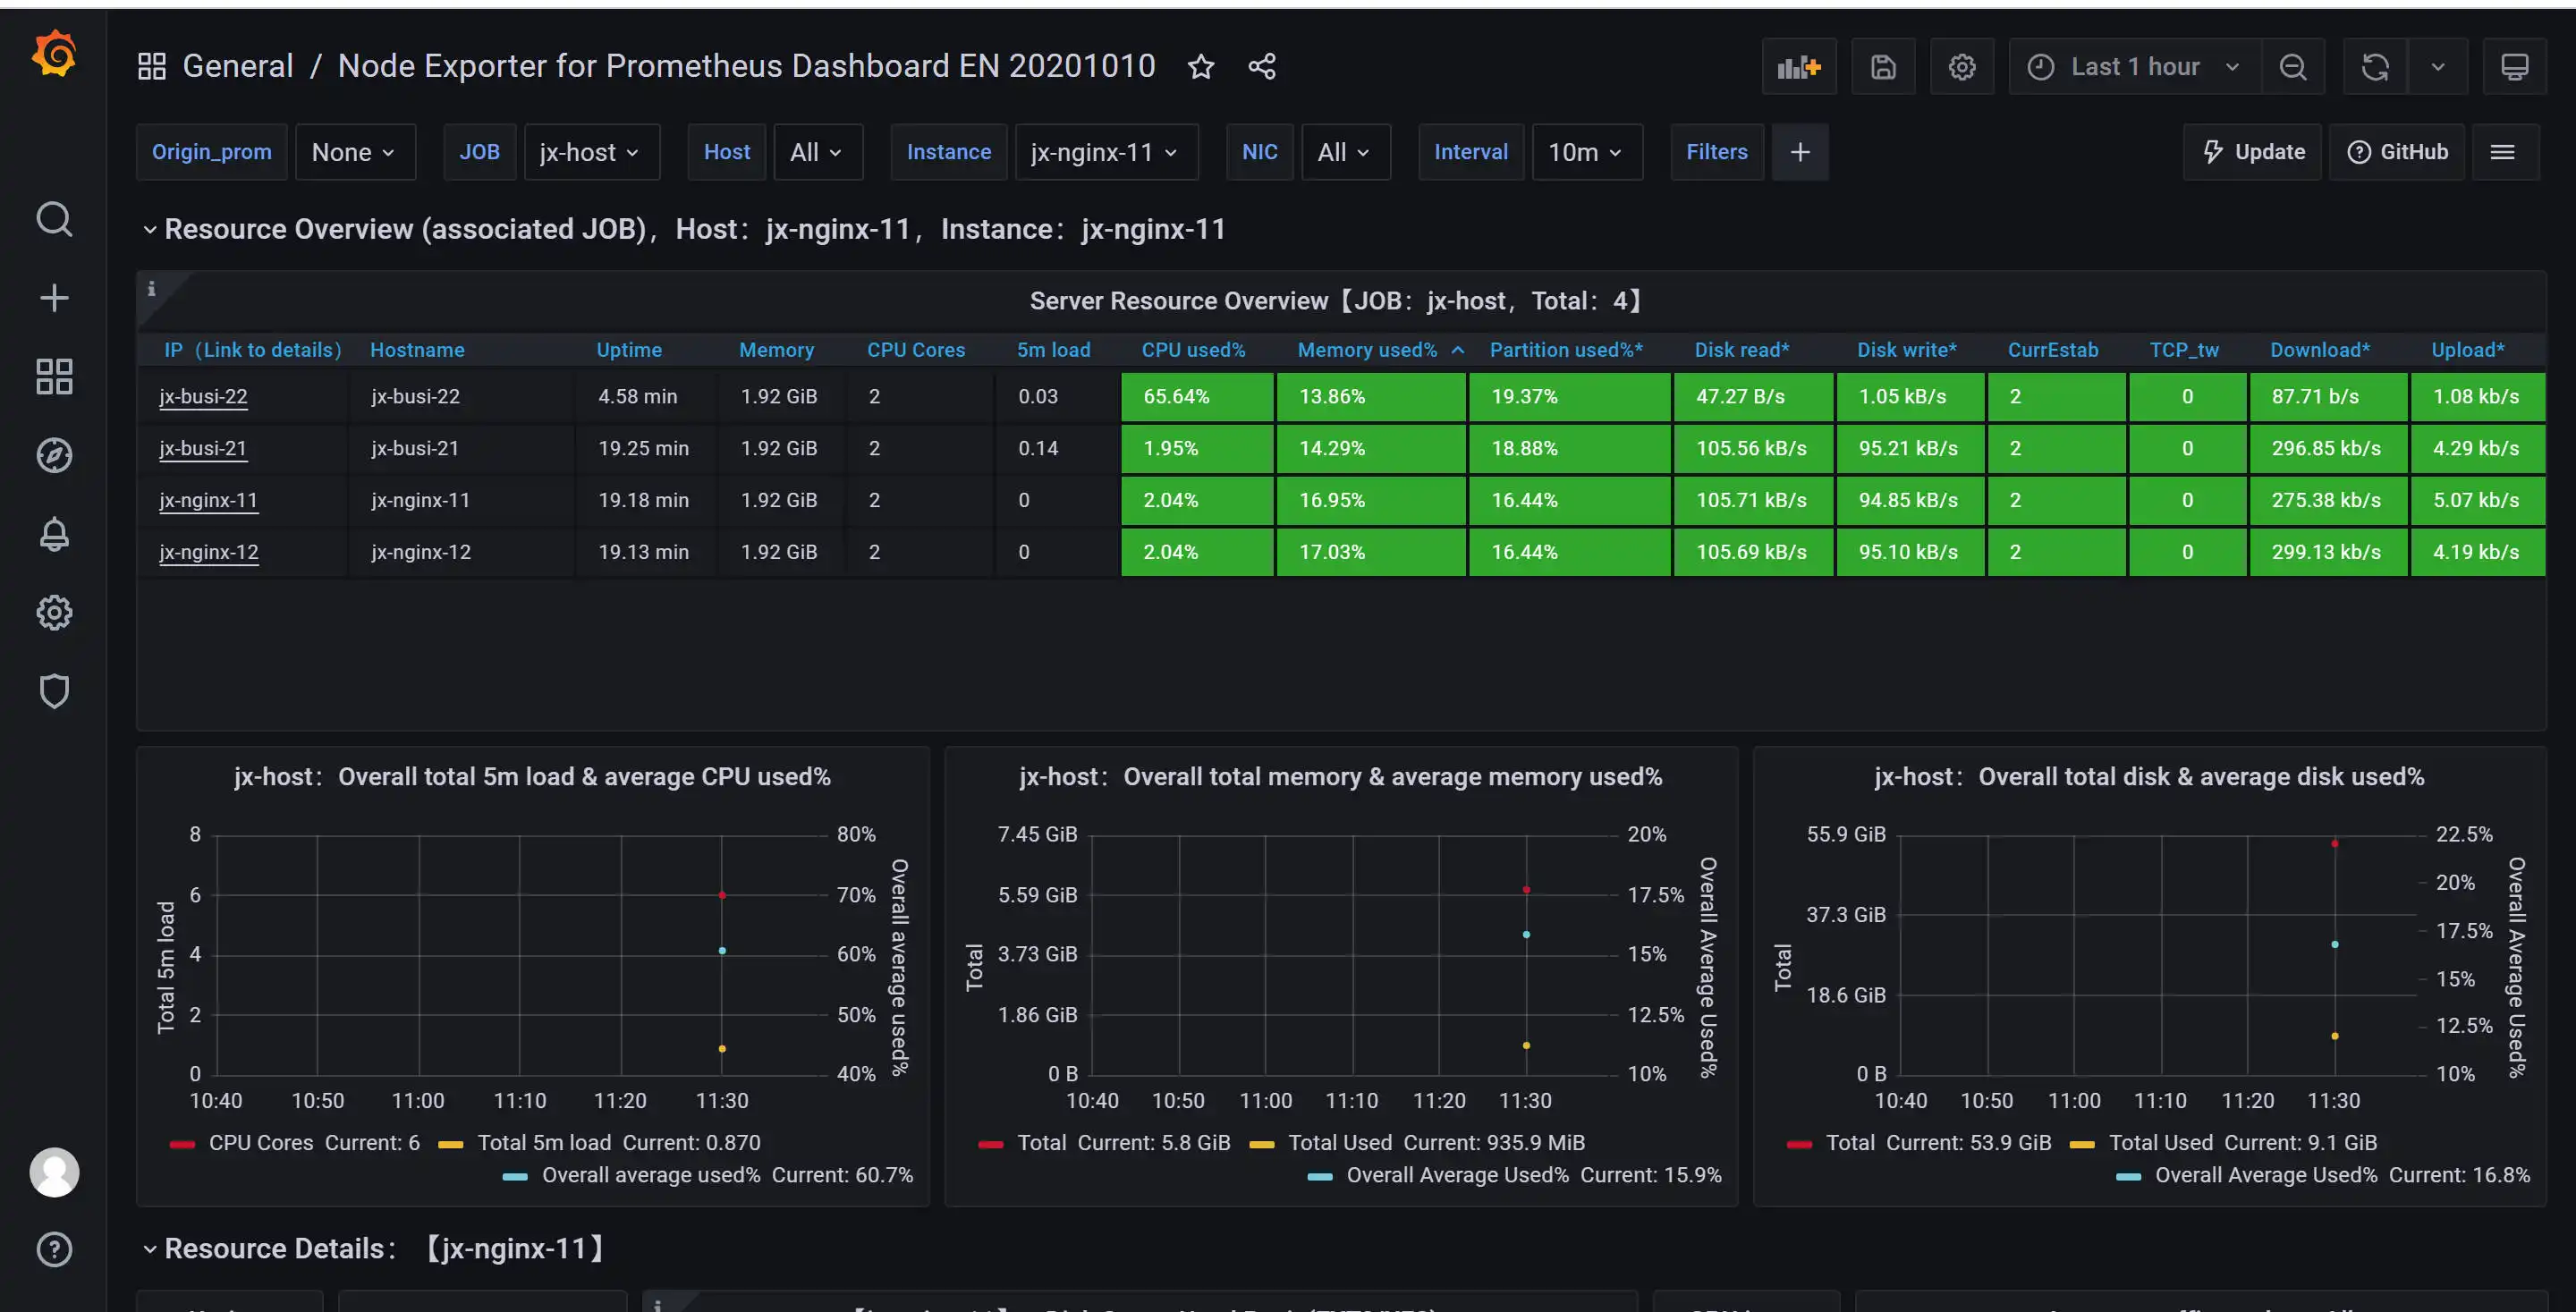
ID:14432最终展示效果:
评论区